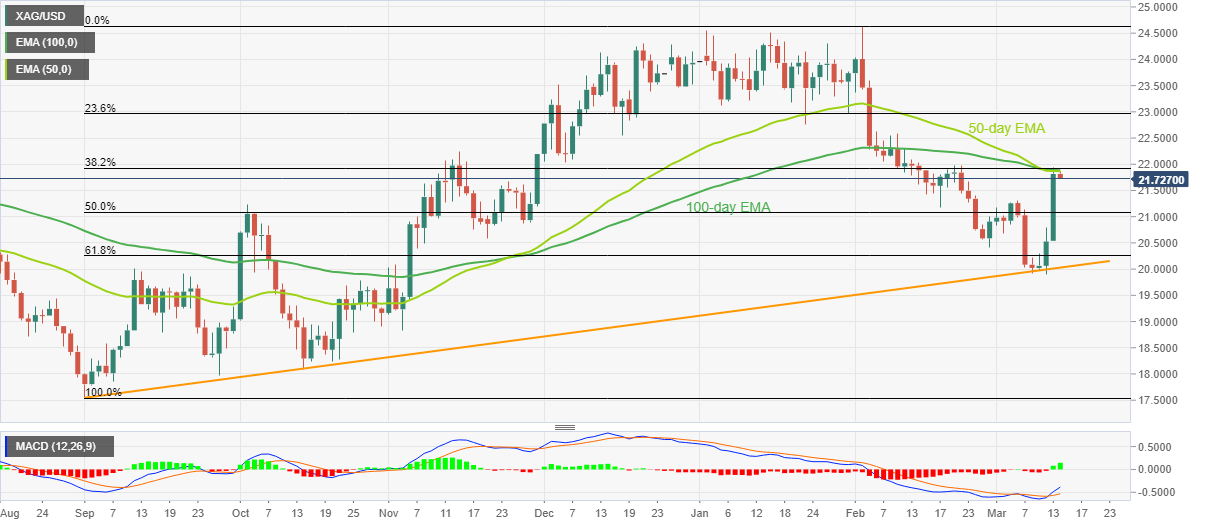
Silver Price Analysis: Key EMAs prod XAG/USD bulls at three-week high near $22.00
- Silver price eases around monthly top after rising the most since early November 2022.
- Convergence of 50-day, 100-day EMAs challenge XAG/USD bulls.
- Bullish MACD signals, sustained bounce off multi-day-old support line keep Silver buyers hopeful.
Silver price (XAG/USD) slides to around $21.70 as bulls take a breather following the biggest daily jump in more than four months. With this, the bright metal traces the Gold price while probing XAG/USD bulls ahead of the key US inflation data.
Also read: Gold Price Forecast: XAU/USD retreats on sluggish Treasury yields ahead of United States inflation
That said, a convergence of the 50-day and the 100-day Exponential Moving Average (EMA) challenges the immediate upside of the Silver price near $21.90. Adding strength to the stated resistance is the 38.2% Fibonacci retracement level of the metal’s run-up from September 2022 to February 2023.
It should, however, be noted that the XAG/USD rebound from the 5.5-month-old upward-sloping trend line, around $20.00 by the press time, joins the bullish MACD signals to keep the Silver buyers hopeful.
Given the quote’s successful break of the $21.90 hurdle, as well as sustained trading beyond the 22.00 round figure, Silver bulls can aim for the 23.6% Fibonacci retracement level surrounding $23.00. Following that, a rally toward the 2023 peak surrounding $24.65 can’t be ruled out.
On the contrary, the Silver price pullback can aim for the 50% and 61.8% Fibonacci retracements, respectively near $21.10 and $20.25 at the latest, before challenging the previously mentioned multi-day-old support line, close to $20.00 by the press time.
It’s worth observing, though, that the XAG/USD weakness below $20.00 could make it vulnerable to testing the November 2022 low of near $18.80. During the fall, the monthly bottom surrounding $19.90 can act as a validation point.
Silver price: Daily chart

Trend: Further upside expected
