EUR/USD Technical Analysis: Fiber is erasing the daily losses as spot is testing 1.1350 level
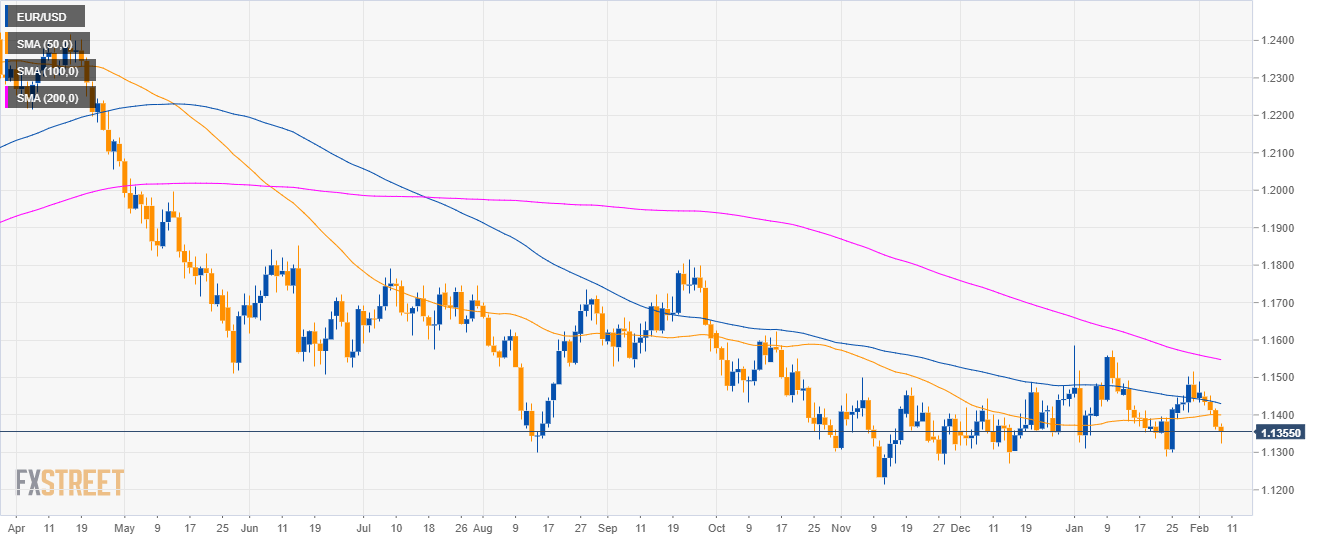
EUR/USD daily chart
- EUR/USD is trading in a bear trend below the 200-day simple moving average (SMA).
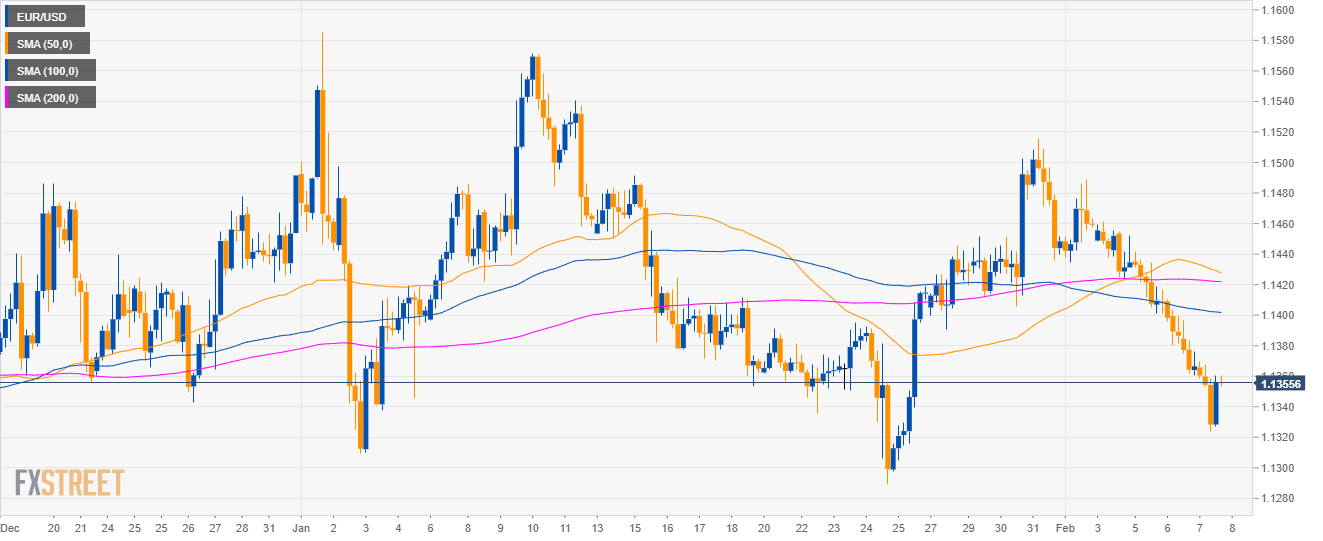
EUR/USD 4-hour chart
- Fiber is trading below its main SMAs suggesting bearish momentum in the medium-term.
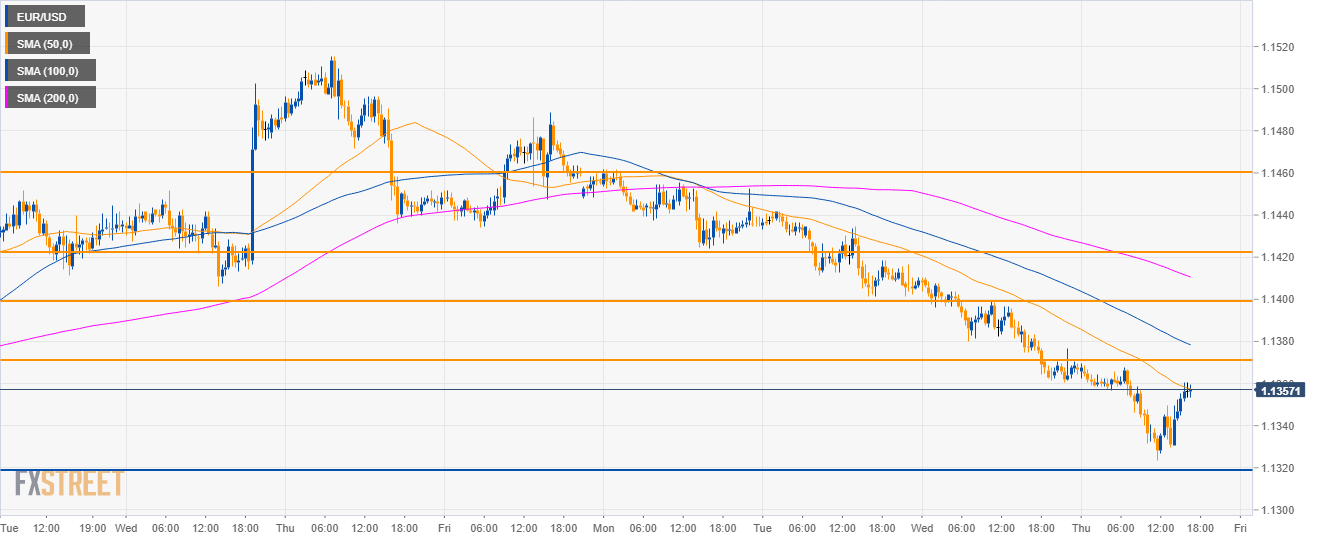
EUR/USD 30-minute chart
- EUR/USD is trading below it main SMAs. As discussed previously, the 1.1320 support was significant as the market reversed up a few pips above that level.
- It seems that bulls have what it takes to get to 1.1370 but they need a significant break above that level in order to regain some control of the market.
- Since the current momentum is bearish, sellers might still potentially come back and collapse the market to 1.13000 figure so buyers should remain prudent.
Additional key levels
EUR/USD
Overview:
Today Last Price: 1.1356
Today Daily change: -12 pips
Today Daily change %: -0.11%
Today Daily Open: 1.1368
Trends:
Daily SMA20: 1.1414
Daily SMA50: 1.1401
Daily SMA100: 1.1434
Daily SMA200: 1.1551
Levels:
Previous Daily High: 1.1416
Previous Daily Low: 1.1362
Previous Weekly High: 1.1516
Previous Weekly Low: 1.139
Previous Monthly High: 1.1586
Previous Monthly Low: 1.1289
Daily Fibonacci 38.2%: 1.1383
Daily Fibonacci 61.8%: 1.1395
Daily Pivot Point S1: 1.1348
Daily Pivot Point S2: 1.1327
Daily Pivot Point S3: 1.1293
Daily Pivot Point R1: 1.1403
Daily Pivot Point R2: 1.1437
Daily Pivot Point R3: 1.1458