Back
11 Feb 2019
AUD/JPY Technical Analysis: 77.50 again triggered the bounce targeting 78.77
AUD/JPY daily chart
- The AUD/JPY pair stretched its Friday’s bounce to near 78.00 during initial trading hours on Monday.
- The 78.77 horizontal-line connecting early January highs seem immediate resistance for the pair, breaking which 50-day simple moving average (SMA) at 79.15 could restrict further upside.
- Alternatively, pair’s declines under 77.50 can avail 77.00 as an intermediate halt prior to slipping through 76.00.

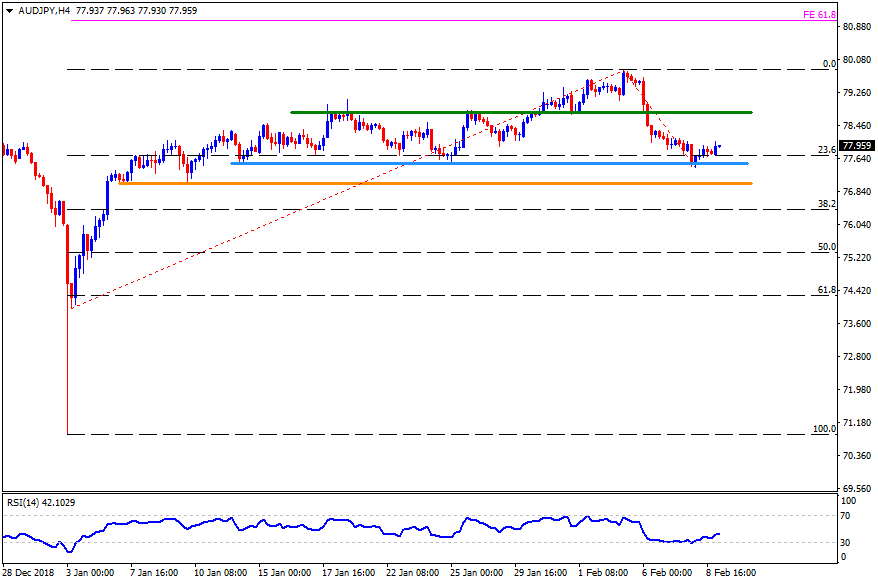
AUD/JPY 4-hour chart
- The H4 chart clearly portrays the pair’s recent bounce off the 77.50 targeting 78.77 with 79.15 and the 79.85 being following resistances to watch.
- Also, the 76.60 may act as buffer during the pair’s slide under 77.00 towards 76.00.
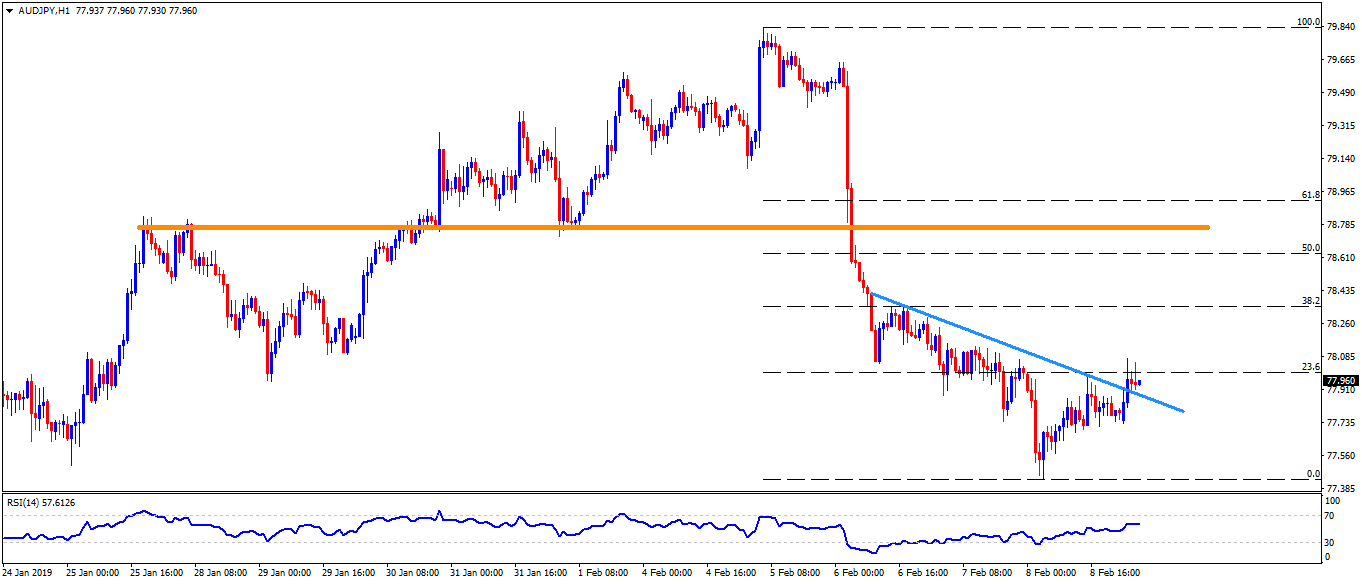
AUD/JPY Hourly chart
- In addition to its U-turn from 77.50, pair’s break of immediate trend-line resistance on hourly chart also favors the AUD/JPY’s upside to 78.77. However, 78.50 may offer a stop during the advances.
- On the downside, 77.70 and the 77.50 can keep limiting the pair’s downturn.