Back
25 Apr 2019
GBP/USD Technical Analysis: Intraday rebound capped at 1.2920 resistance
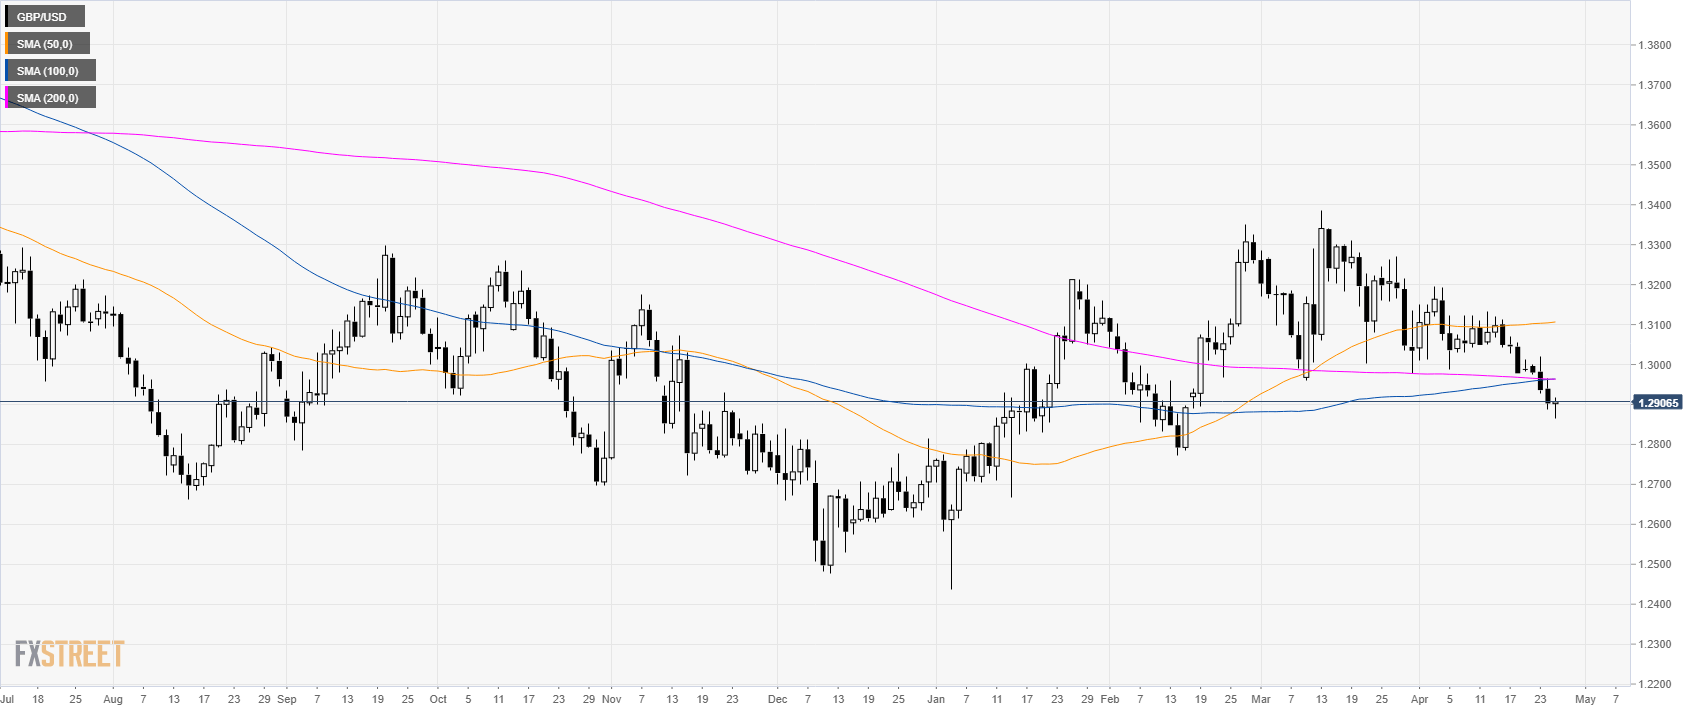
GBP/USD daily chart
- GBP/USD is trading below its main SMAs suggesting an overall bearish bias.
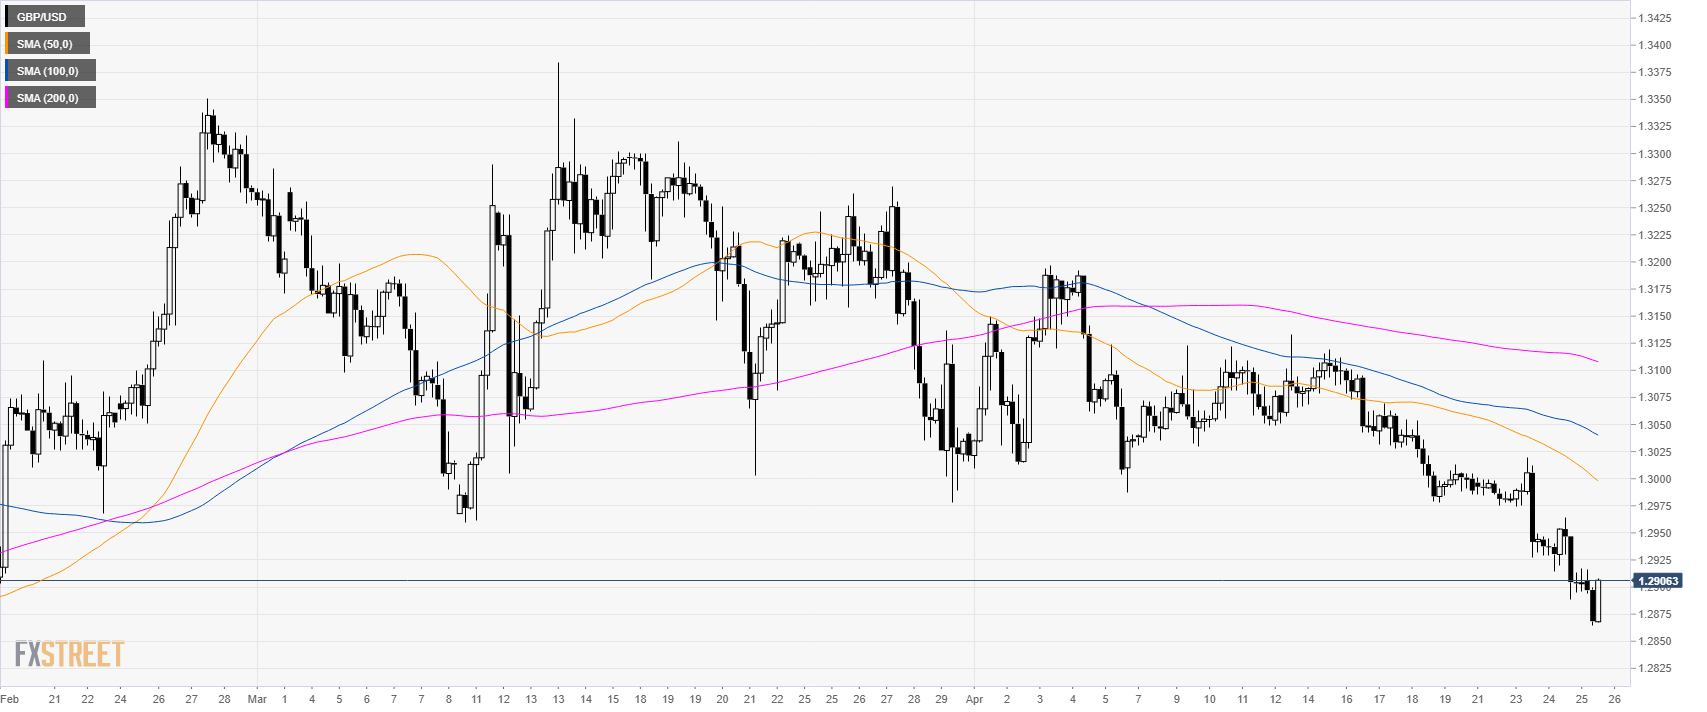
GBP/USD 4-hour chart
- GBP/USD is trading below its main SMAs suggesting bearish momentum in the medium-term.
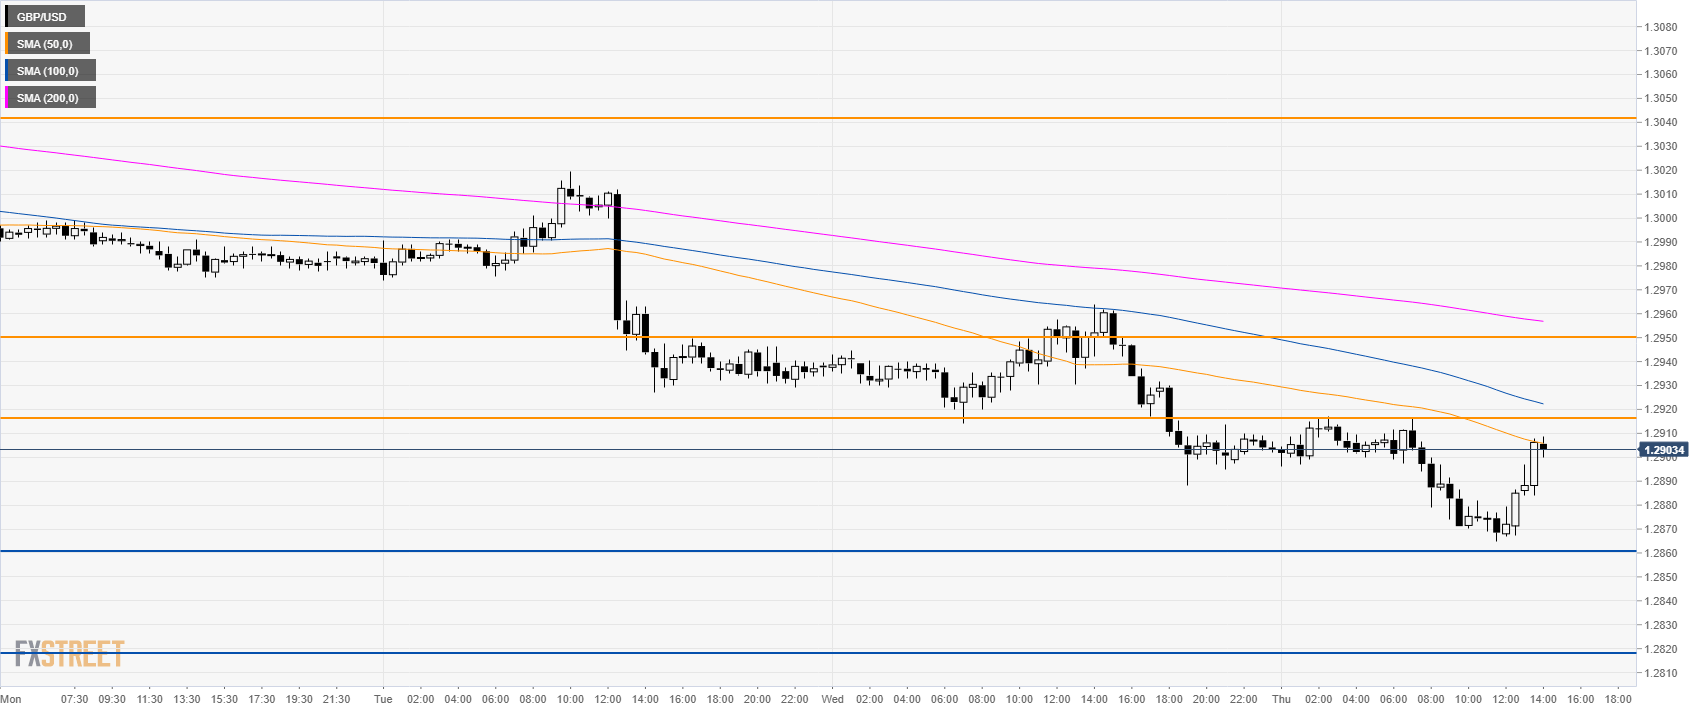
GBP/USD 30-minute chart
- The market is having a rebound from the 1.2860 support but remained capped below the 1.2920 resistance and the 50 SMA.
- The bias remains bearish on the Cable as the level to beat for bears is at 1.2860 and 1.2820 to the downside.
- Resistances are at 1.2920 and 1.2950 level.
Additional key levels