Back
31 Jul 2019
USD/IDR technical analysis: 14,078/82 becomes the tough nut to crack for buyers
- The USD/IDR pair’s recent recovery nears the key resistance confluence.
- A pullback can highlight the month’s low fur sellers to watch.
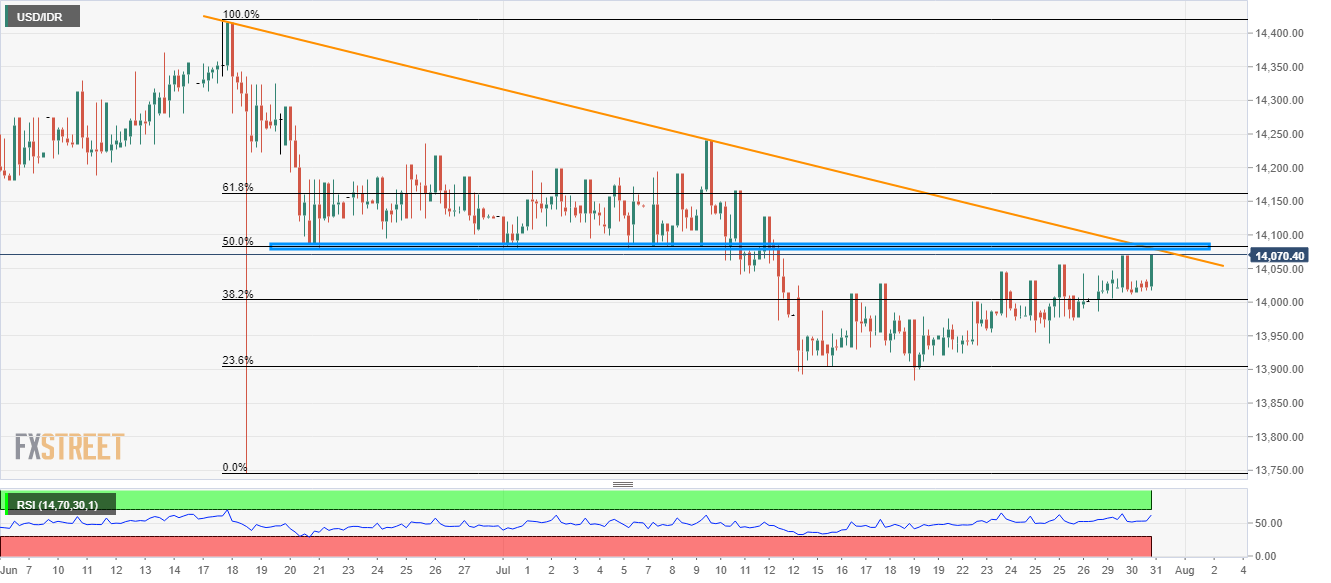
Despite registering gradually recoveries since July 19, USD/IDR is yet to cross key resistance confluence as it trades near 14,070 during early Wednesday.
The crucial upside barrier at 14,078/82 comprises multiple lows marked since late-June to early-July and a six-week-old descending trendline, not to forget 50% Fibonacci retracement of June month’s decline.
In a case where buyers manage to cross 14,082 resistance, 14,128/30 and 61.8% Fibonacci retracement level of 14,162 can act as buffers during the run-up to 14,200 mark.
On the downside, 38.2% Fibonacci retracement level around 14,000 becomes the key support, a break of which can recall 13,884 support level that encompasses the beginning of the latest recovery.
USD/IDR 4-hour chart
Trend: Pullback expected