Back
30 Dec 2019
USD/JPY Price Analysis: Greenback dropping against yen, trading sub-109.00 handle
- USD/JPY is tumbling from the December highs while trading below the 200-period weekly simple moving average.
- The level to beat for bears is the 109.75 support.
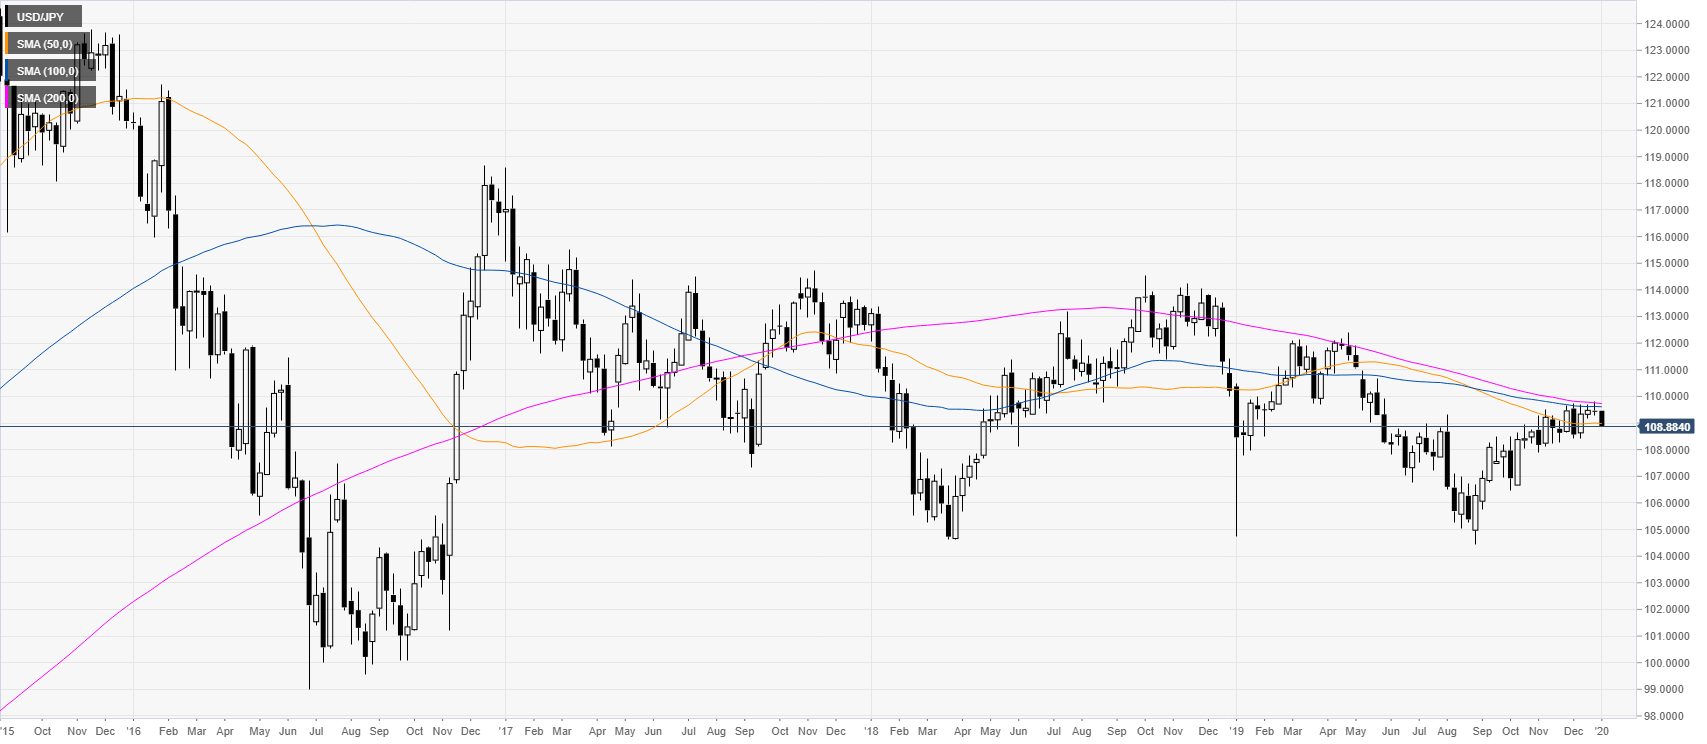
USD/JPY weekly chart
In the last month of the year, the market has been capped below the 110.00 handle and the 100/200-period weekly simple moving averages (SMAs).
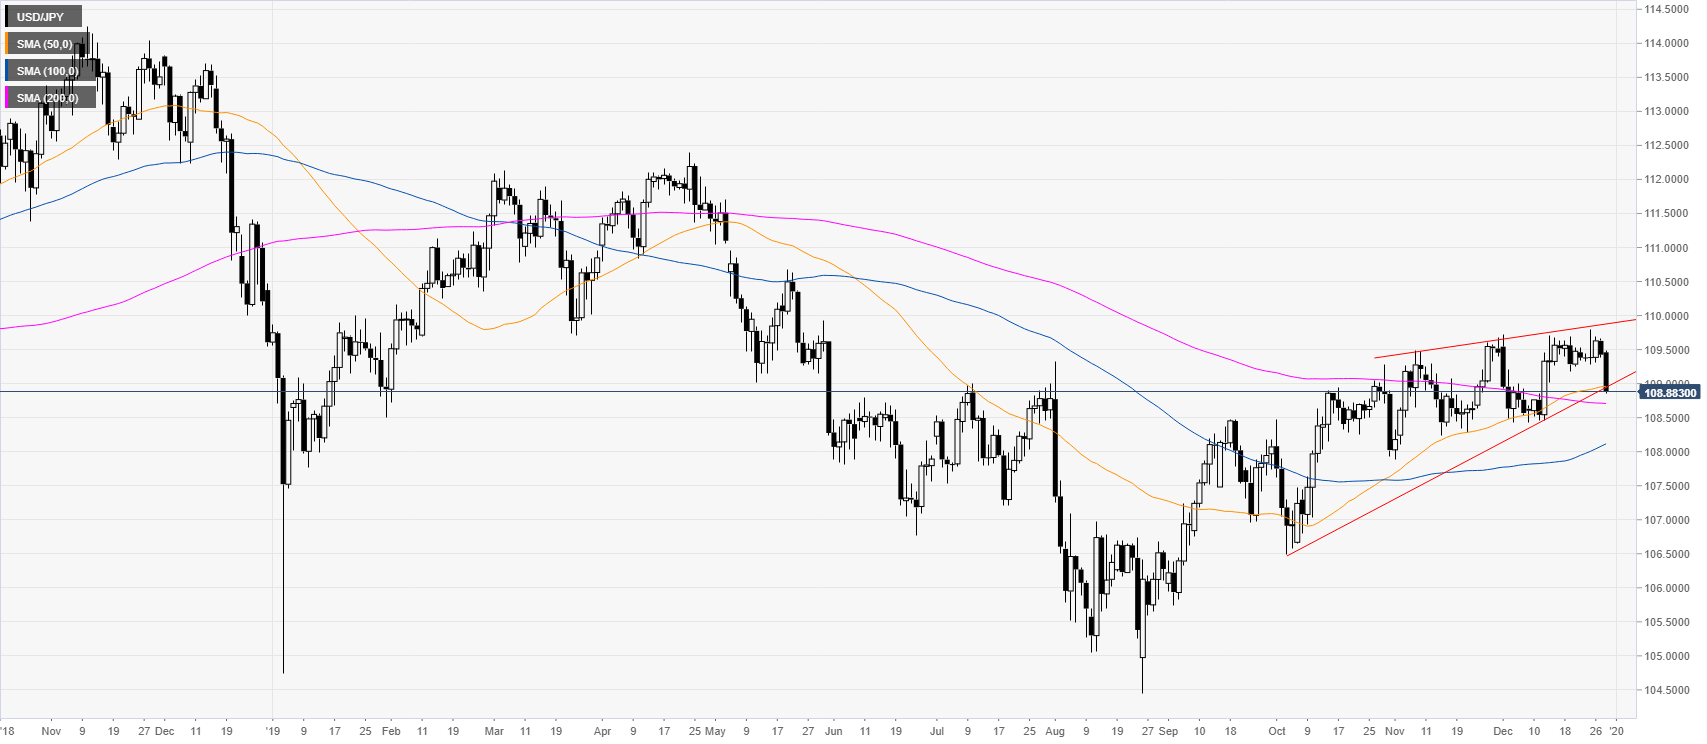
USD/JPY daily chart
USD/JPY is easing from the December highs while in a rising wedge formation. The spot is nearing the 200-day SMA near 108.70.
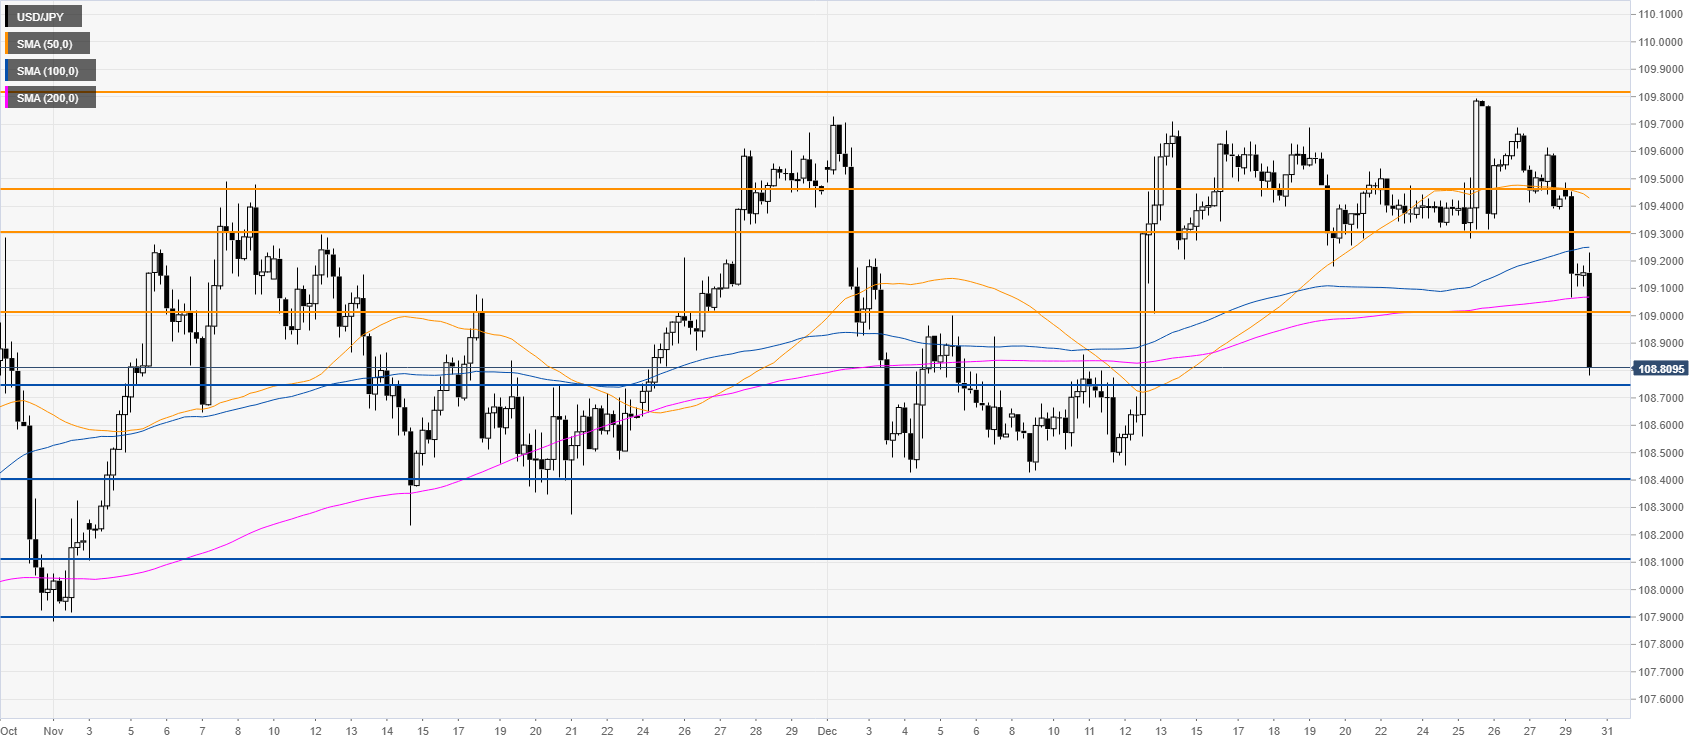
USD/JPY four-hour chart
The market is spiking down below the main SMAs as bears are taking over. The market is approaching support near 108.75. A break below this level can open the doors to further losses towards 108.40 and the 108.11/107.90 price zone, according to the Technical Confluences Indicator. Resistance is seen at 109.02, 109.30, 109.47 and the 108.81 level.
Additional key levels