Back
24 Jan 2020
EUR/USD Price Analysis: Euro ends the week below 1.1039 resistance
- EUR/USD stays under heavy bearish pressure below the 1.1039 resistance.
- The downside move could reach the 1.0976 and 1.0953 levels.
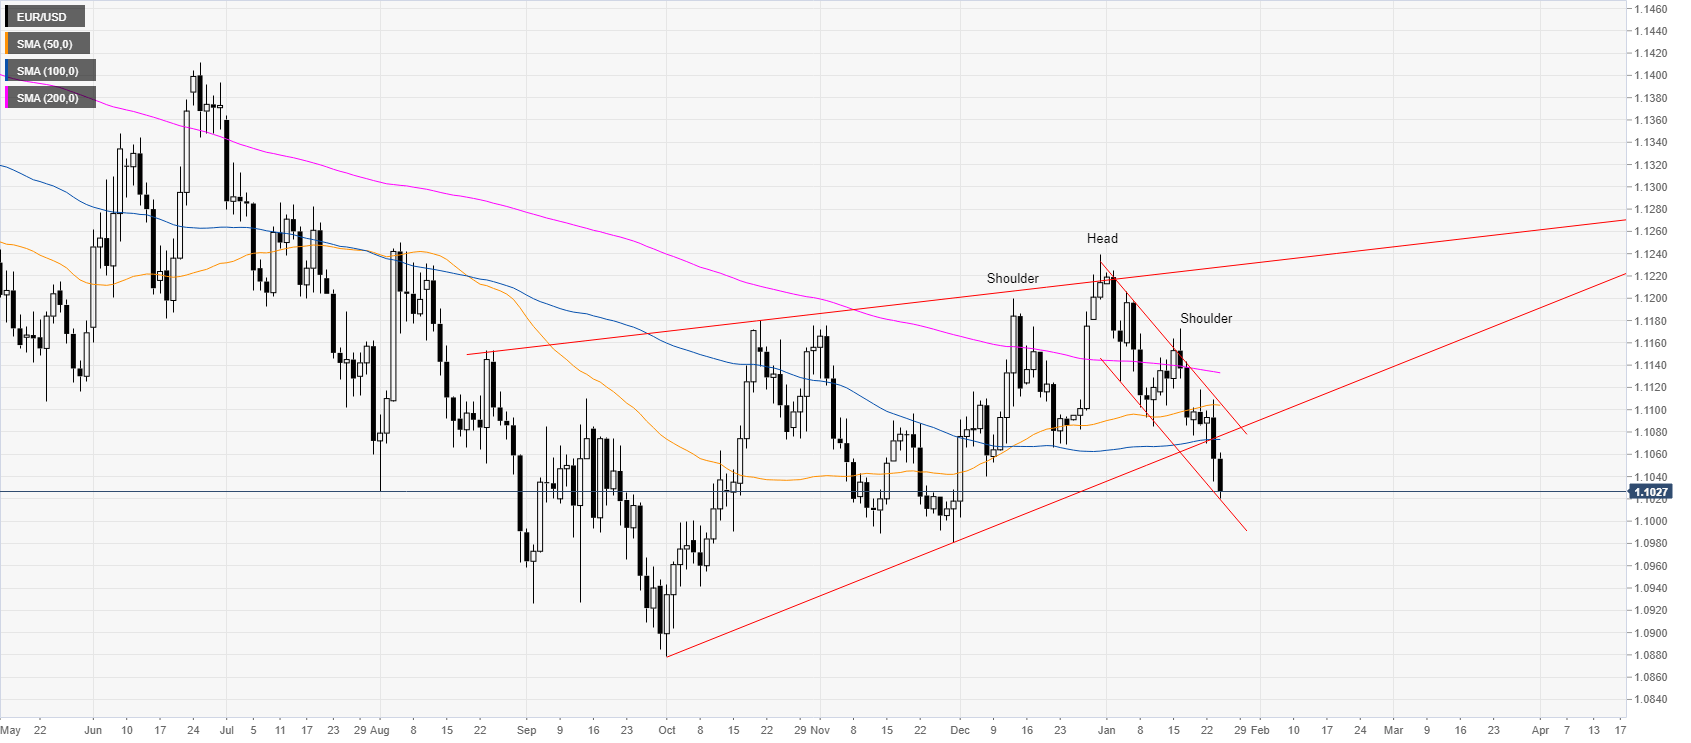
EUR/USD daily chart
EUR/USD is trading in a weak bear trend below its main simple moving averages (SMAs) as the market is breaking down through a bullish trendline which started in October 2019. EUR/USD formed a head-and-shoulders pattern which is driving the spot near two-month’s lows.
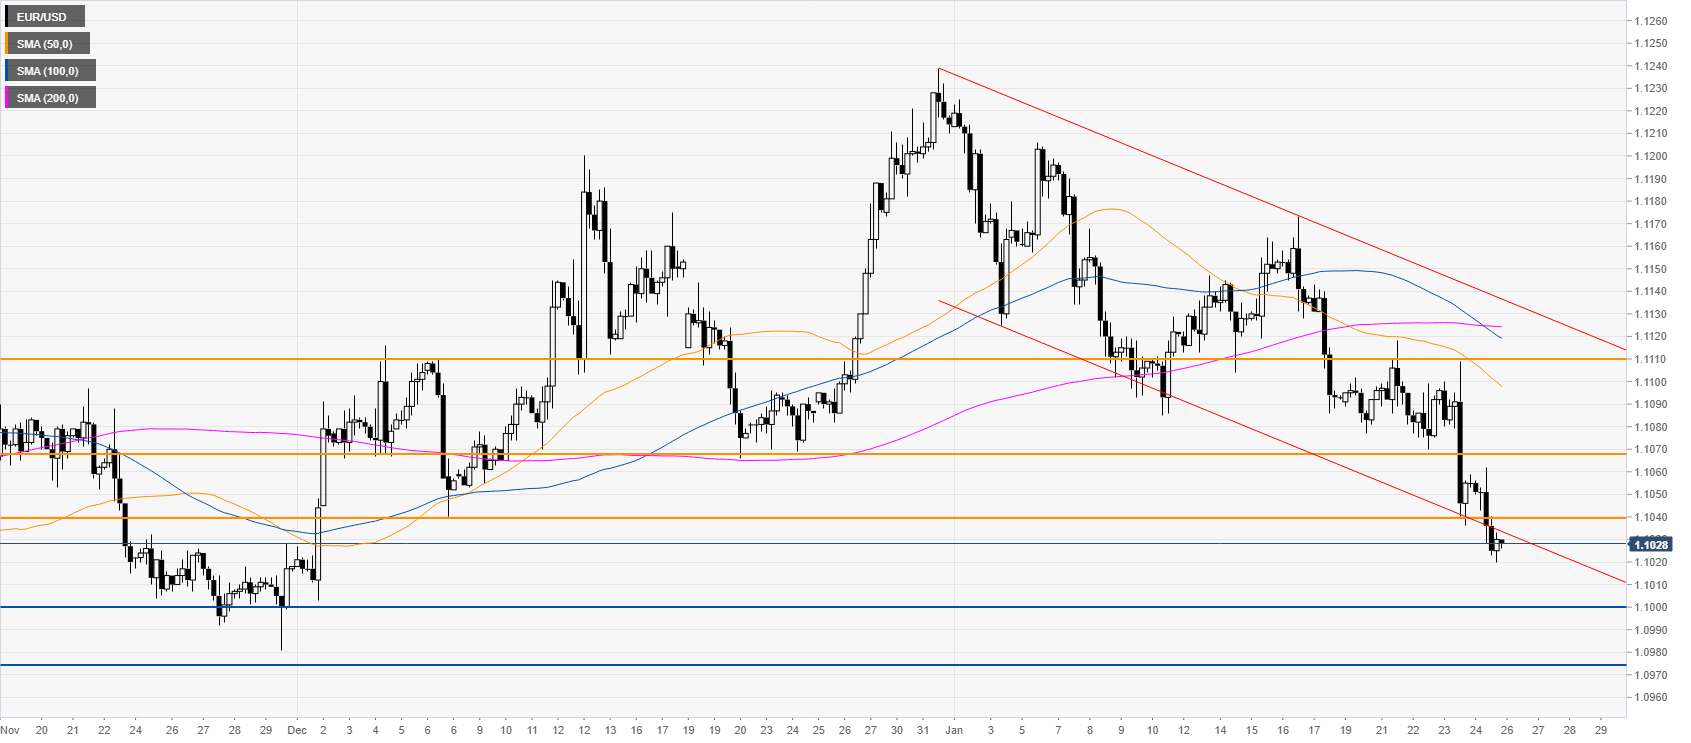
EUR/USD four-hour chart
The market is trading in a descending channel below its main SMAs as the bears broke below the 1.1039 support. The break below this level can lead to further downside towards the 1.1000 and 1.0976 and 1.0953 levels, according to the Technical Confluences Indicator.
Additional key levels