AUD/USD Price Analysis: Bearish bias intact while below 50-SMA on 4H chart
- AUD/USD sold-off heavily into virus-woes fuelled USD’s upsurge.
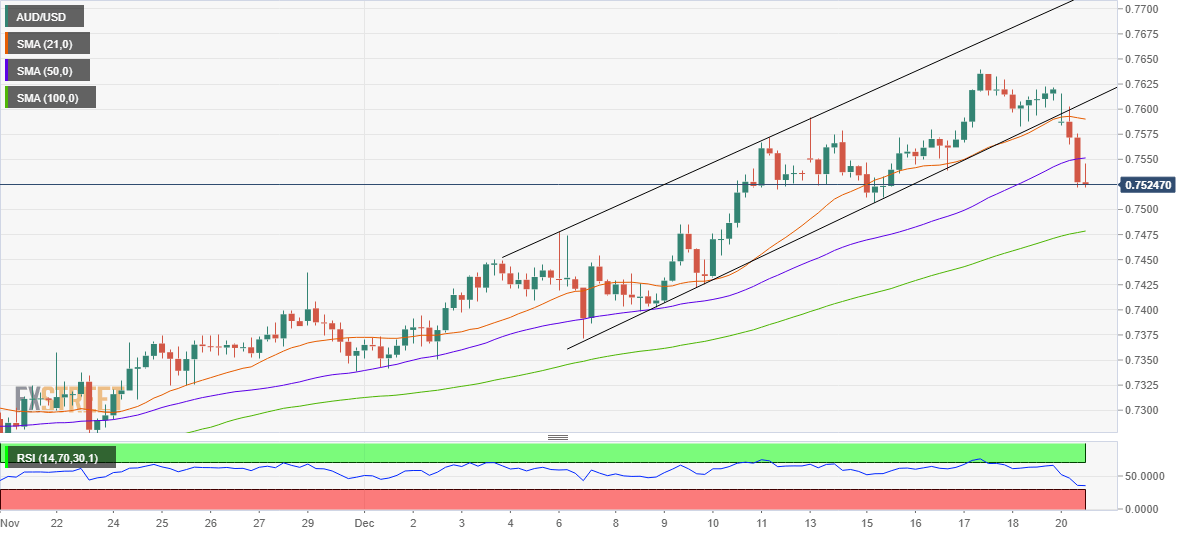
- The aussie confirmed a rising channel breakdown on the 4H chart.
- 50-SMA is the level to beat for the bulls now.
AUD/USD remains vulnerable, holding onto heavy losses incurred below the 0.7600 level in the European session.
The new covid strain found in the UK prompted investors to risk and flock to the safe harbor, the US dollar.
At the time of writing, the aussie drops 1.28% to trade near multi-day troughs of 0.7522.
From a technical perspective, the sell-off in the spot picked-up pace after the price confirmed a rising channel breakdown on the four-hour chart in early Asian trades.
The spot eyes a test of the upward-sloping 100-Simple Moving Average (SMA) at 0.7478. Ahead of that the 0.7500 cap could challenge the bears’ commitment.
Meanwhile, any recovery attempts could face a strong hurdle at the 50-SMA at 0.7551. Acceptance above that level is likely to bring the 21-SMA at 0.7590, the previous support now resistance, back in play.
The Relative Strength Index (RSI) remains in the bearish zone but above the oversold territory, suggesting that there is more room to the downside.
AUD/USD: Four-hour chart
AUD/USD: Additional levels