WTI Price Analysis: Oil buyers need $72.20 breakout to retake controls
- WTI eases from intraday top, remains mildly bid.
- Convergence of 200-SMA, three-week-old descending trend line probes bulls.
- Pullback moves can retest weekly support line, MACD portrays traders’ indecision.
WTI crude oil fades early Asian strength, eases to $71.90 by the press time of pre-European session trading on Wednesday. Even so, the black gold prints 0.27% gains on a day while keeping the previous day’s rebound from $70.90.
With the sluggish MACD conditions, bearish of late, the recent tops surrounding $72.20, also including 200-SMA and a downward sloping trend line from July 06, will keep testing the oil bulls.
However, a clear upside break of the same won’t hesitate to recall the $75.00 to the chart, comprising the mid-month top, before directing the energy buyers toward the monthly top near $76.40.
Alternatively, a pullback move, which is widely expected, will revisit a week-old support line near $70.80, a break of which will direct the WTI sellers to the $70.00 threshold.
It should be noted though that the oil bears’ dominance past $70.00 will be questioned by the last Thursday’s low near $69.70 before highlighting the monthly low surrounding $65.00.
WTI: Four-hour chart
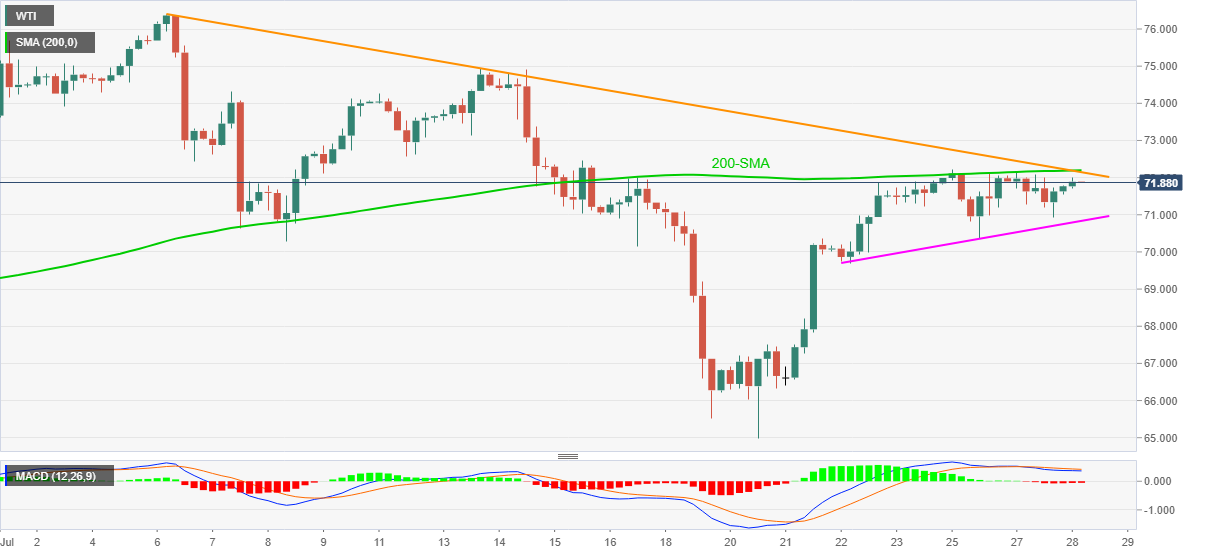
Trend: Sideways